The new Lidar Lite V3 sensor may be useful for height control of a quadcopter. We want to integrate one of this sensors into our new Asctec Firefly quadcopter for safe indoor flight. The first step of the integration is a complete sensor characterization in order to determine its parameters.
Experimental setup
Materials:
- Arduino UNO
- Electrolytic Capacitor with the value stated on the manual (or with more capacity).
- Lidar Lite v3
- Bosch professional GLM 50 C laser measure device (as ground truth)
- Ruler on the ground
We connected the Lidar Lite v3 to the Arduino UNO using the example configuration found in the manual, we then fixed everything to a board for convenient manipulation. In the software side, we used as reference the example found in the Arduino Library for the Lidar Lite V3 provided by Garmin, we tested that everything was working with our configuration and finally we integrated this code with ROS Serial in order to be able to conveniently process the information in ROS. The final code used in the Arduino with a small tutorial for using with ROS can be found in our Github Repository: TODO!.
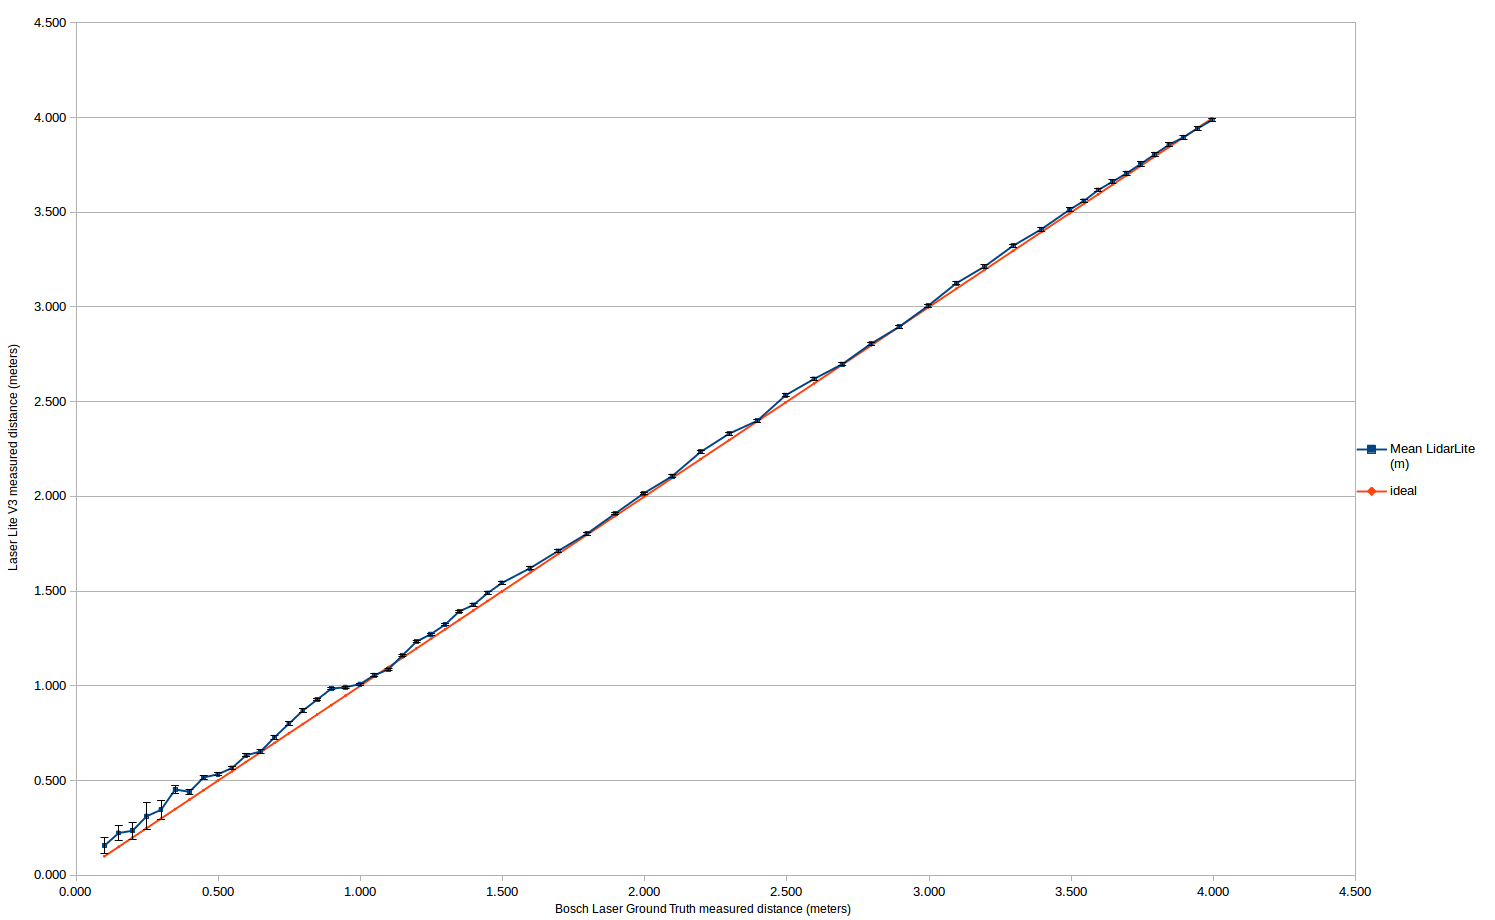
A ruler was attached to the ground which allows us to measure distances from 0 to 4 meters in our laboratory. The board with the laser was fixed at position 0 of the ruler.
Note: The base of the Lidar Lite V3 is the base distance reference for all the measurements provided by the laser.
We used for testing another board with a black diffuse material since it gives worse performance than a clear white paper. This board was moved from the maximum distance of the ruler (4m) until the closest distance possible to the laser in intervals of 10 centimeters, for each distance the board was situated perpendicular to the laser and 1000 measurements were obtained for each distance. We developed for this experiment a live histogram tool in ROS (TODO) which connect to the Laser distance topic and then creates a histogram with the data and provides as well the mean value and variance. Additional measurement every 5 centimeters were taken from 0 to 1.5m due to some unexpected non linear effects found on the first pass. The ground truth of the distance was measured using the high precision Bosch professional GLM 50 C device.
The results obtained can be seen in the following graph:
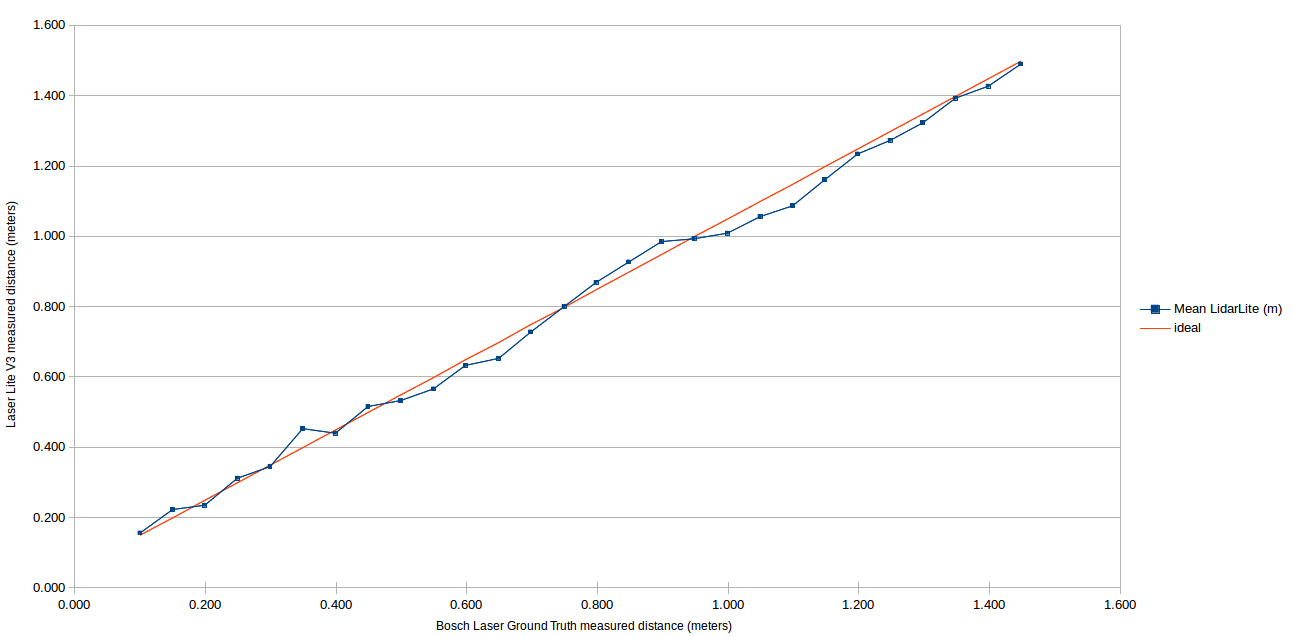
A zoom of the problematic area (distances between 0 and 1.5m):
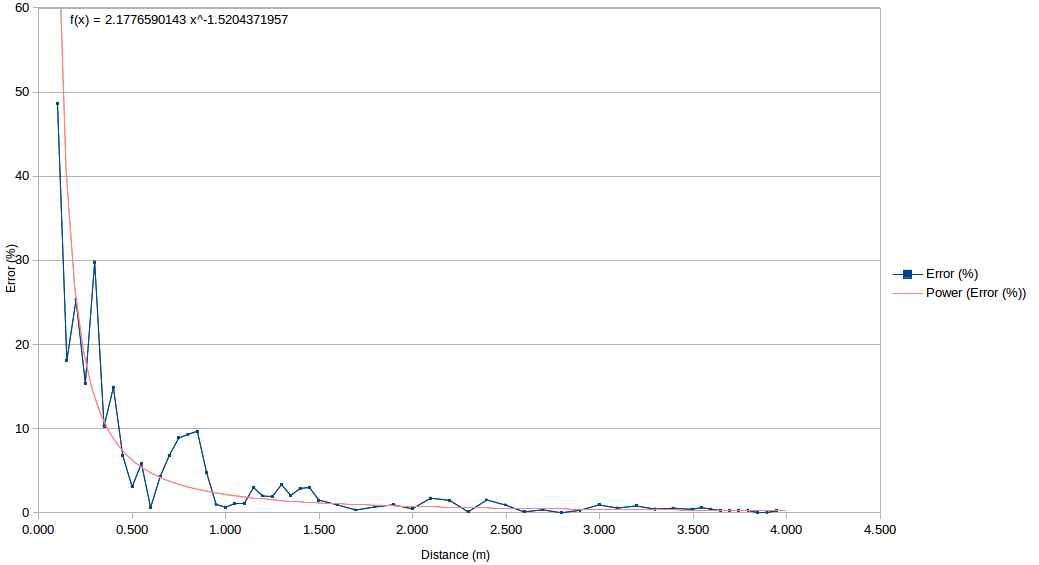
Relative error (as a percentage of the measured distance):
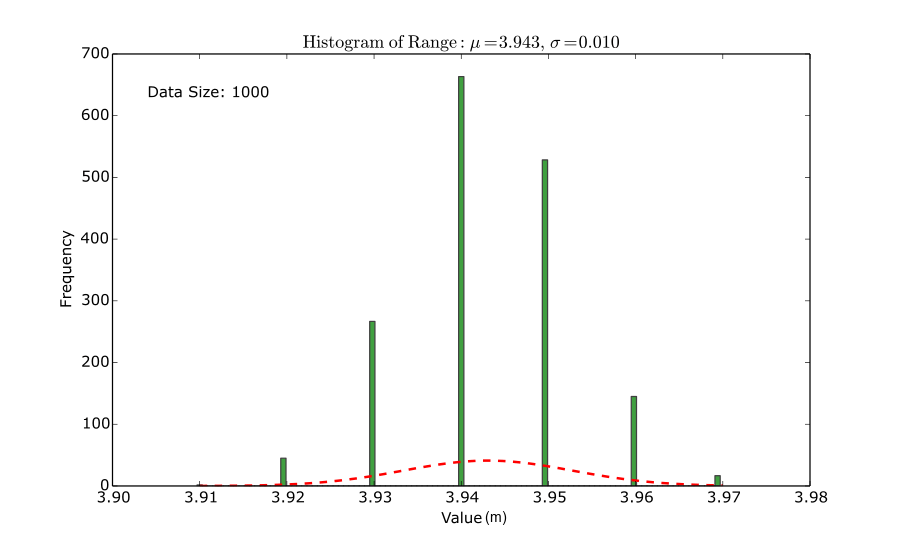
Histogram at a distance of 3.95m:
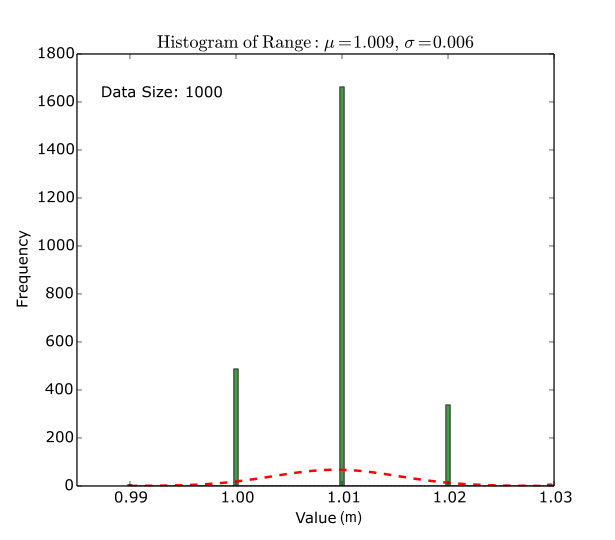
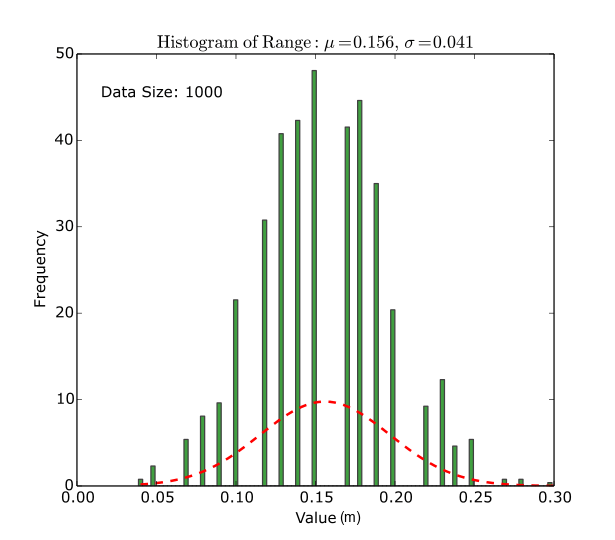
Histogram at a distance of 1m:
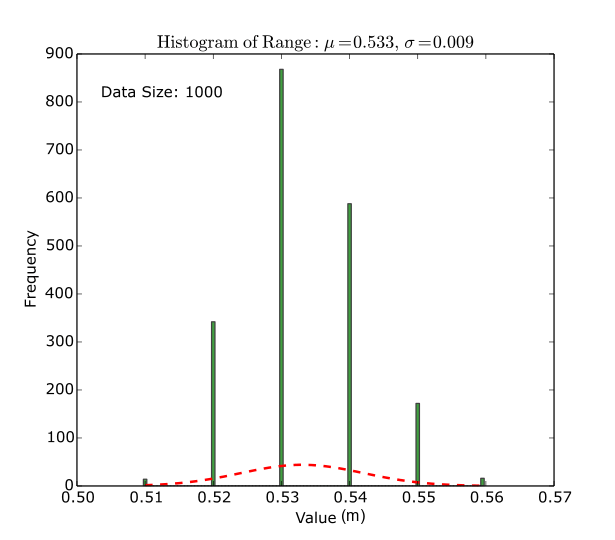
Histogram at a distance of 50cm:
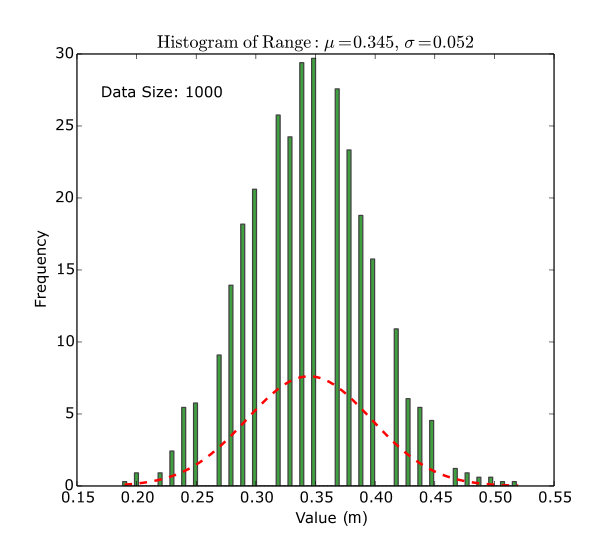
Histogram at a distance of 30cm:
Histogram at a distance of 10cm:
TODO: Result analysis
Hi.. Prof. Raul
sorry i’m newbie about lidar lite .. currently studying and trying lidar lite. please help to solution question of how to: (1) lidar lite data acquisition from arduino to raspberry pi .. (2) lidar lite process for navigation: localization and obstacle avoidance
Hi, I haven’t done something similar yet. But I assume that first, you should connect your Arduino to the Raspberry Pi using serial communication (http://www.instructables.com/id/Connect-Your-Raspberry-Pi-and-Arduino-Uno/) and then you can use the Arduino Library for the Lidar Lite to obtain the sensor readings and send them through the serial port to the Raspberry PI. Cheers!.
Hi.. Raul..
I’m currently studying and trying garmin lidar lite v3.please help to questions how to : (1) acquire lidar lite data from arduino to raspberry pi (2) processing lidar lite data to opencv for navigation: localization and obstacle ovoidance..
Thanks
Hi, Dr. Raul. Have you ever tested Benewake LiDAR TF02 ? Thanks.
Dear Siya, I am not a Dr…. yet! :). I haven’t tried that one yet but it seems to be good as well.
Thank you, Raul. Hope you can have a look at Benewake LiDAR Application Video: https://www.youtube.com/watch?v=JtzMtuu29KM. Your comments are highly appreciated. Thanks for your time.
Thanks Mr. Raúl for sharing this informative post
i want to ask where could i find the final code
you mentioned here “The final code used in the Arduino with a small tutorial for using with ROS can be found in our Github Repository”
i didn’t find any related codes in Github
Well, it happens that you say to yourself “let’s upload the code later” and then you keep on going and forget to do it. You can find the code here: https://github.com/raultron/lidar-lite-v3-ros, please tell me if it works for you. Cheers!